NIQ Record Library

Year

2022

Company

Nielsen IQ, a consumer intelligence company with operations in 100+ markets, covering more than 90% of the world's population.

Problem

How might we make NIQ's data reporting tools easier to use for non-data scientists?

Solution

Design a curated report library with plug-and-play templates for common business questions.

Role

I was the lead designer, working closely with the product owner and a design manager.

Disciplines

Human Interface Design

Interaction Design

Product Strategy

Research

Design Systems

Visual Design

Achievements

50k

New users in the first 12 months.

4.4

/5

Average usability score given by usability test participants

1

Promotion received for my work on this project.

Achievements

50k

New users in the first 12 months.

4.4

/5

Average usability score given by usability test participants

1

Promotion received for my work on this project.

Achievements

50k

Fewer steps in the redesigned property record checkout flow.

4.4

/5

Average usability score given by usability test participants

1

Promotion received for my work on this project

Discovery

Discovery

Discovery

Heuristic analysis

Heuristic analysis

Heuristic analysis

Although a preliminary version of this feature existed in the product already, key stakeholders determined that it needed to be more functionally robust and user-friendly. I began by reviewing the existing design.

FINDINGS

01

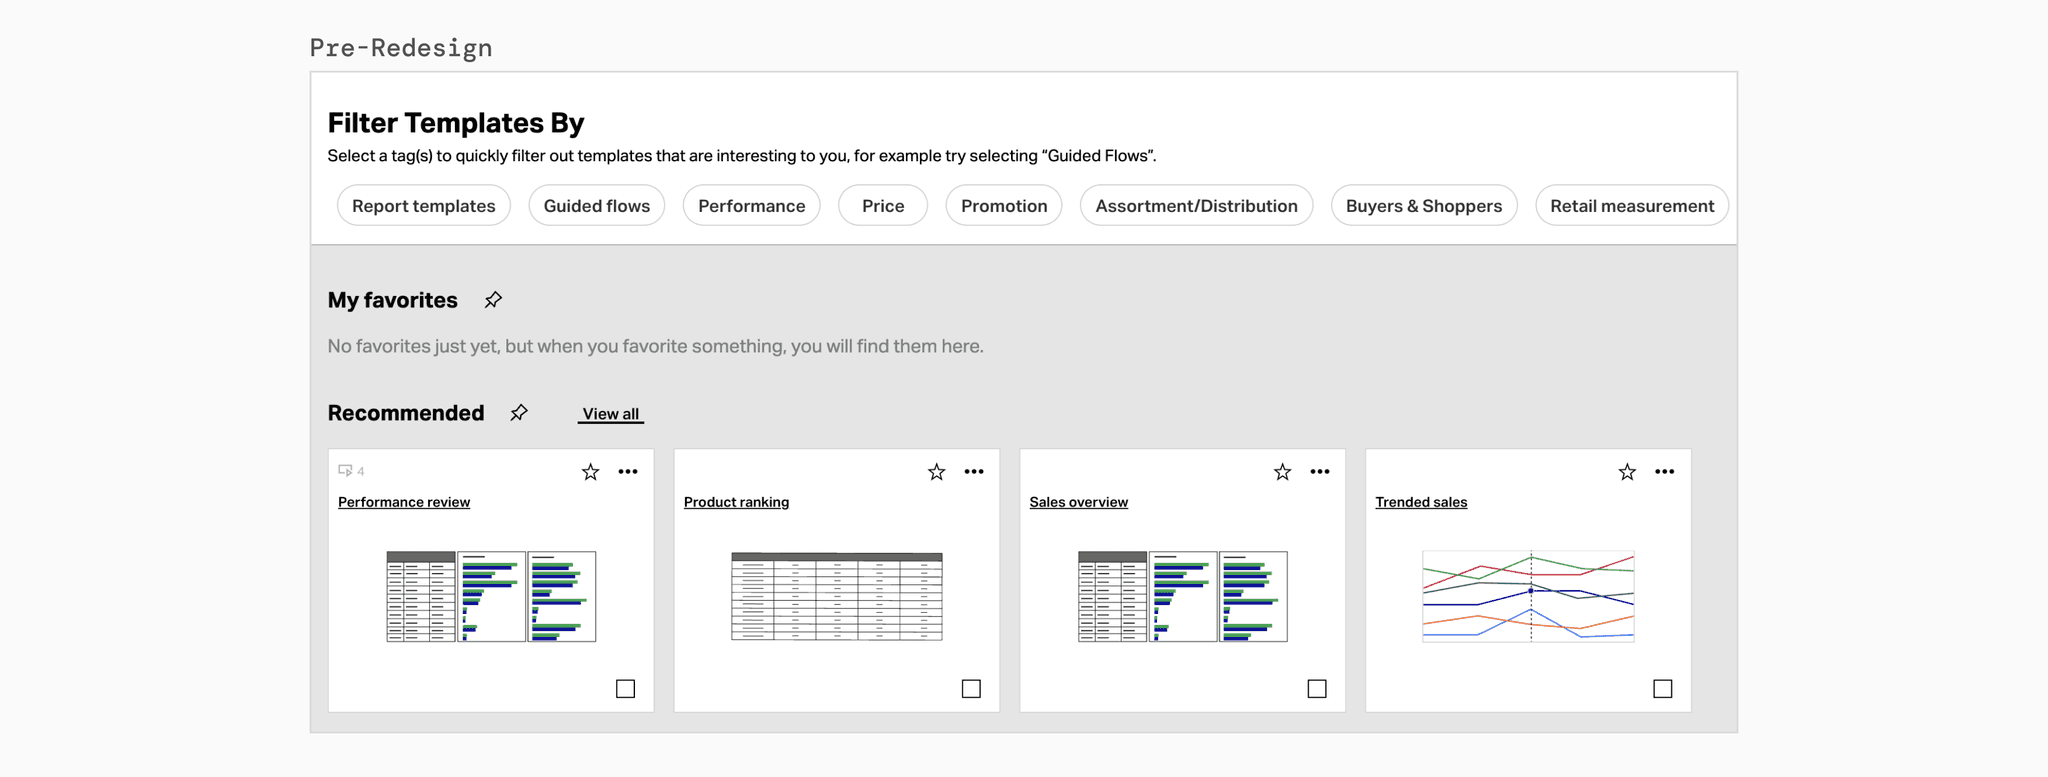
The filters lacked hierarchy and groupings, despite the fact that there were different filter categories

02

If the end-user isn't an expert, why is it assumed that they will know what these terms mean?

03

Feature affordances were not disclosed: what could the user expect from a template?

03

The intended next action is not clear: what would the checkbox do?

Interviews

Interviews

Interviews

Next, the design systems lead and I conducted interviews with client reps in order to understand what types of information end-users most frequently needed help finding. We wanted end-users to be able to get what they needed out of the product without external assistance.

FINDINGS

01

We should give users control over how much guidance they receive, from full guardrails to fully self-directed

02

Users range from c-suite executives to market researchers, brand managers, category analysts, and price managers

03

Users either work for brands trying to sell more of their products, or retailers trying to optimize sales

04

Ultimately, the goal is to understand market trends and shopper behavior
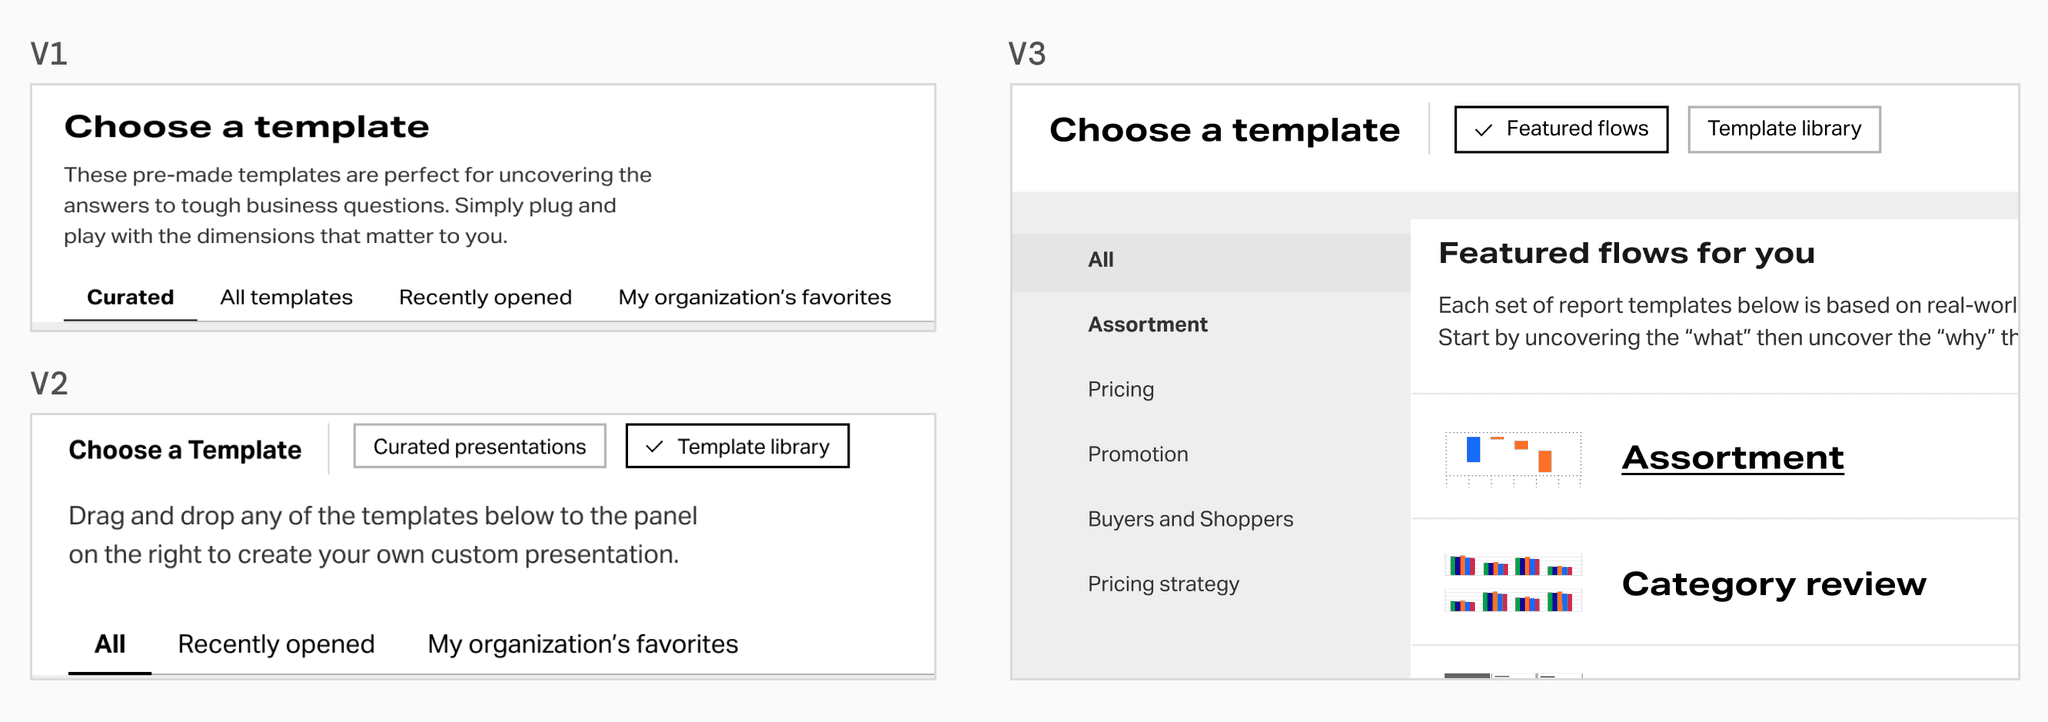
Wireframing and Usability Testing

Wireframing and Usability Testing

Wireframing and Usability Testing

Early iteration

The biggest challenge was the establishment of a clear hierarchy between report type, data type, and business question. These early explorations tried to find clarity through trial and error. There was also a lot of back and forth about what to call the templatized report groupings.

Usability testing

Once we hit mid-fidelity, we decided to do a round of usability testing in order to ensure our designs aligned with user expectations.

FINDINGS

01

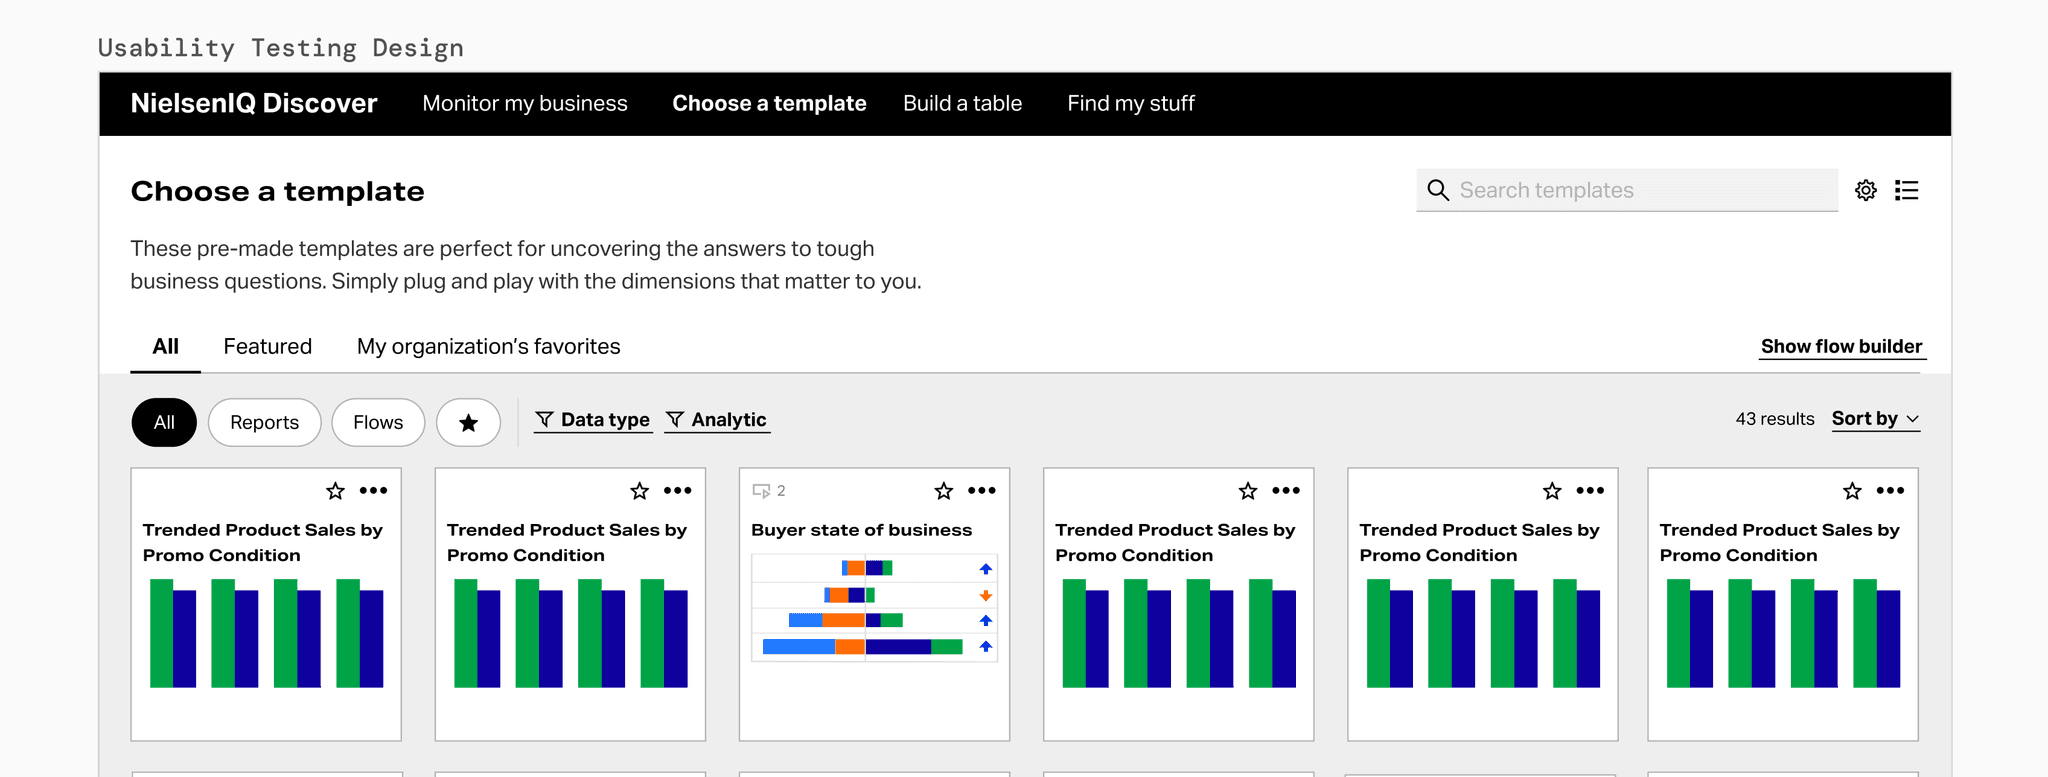
Users didn't immediately understand what the novel terms like "flow builder" meant

02

We A/B tested two report card designs and identified user preferences

03

Users expected the report template section and the general report library "Find my stuff" to converge in a sigle tab

04

We needed to more clearly identify which reports required special subscription permissions

High Fidelity

High Fidelity

High Fidelity

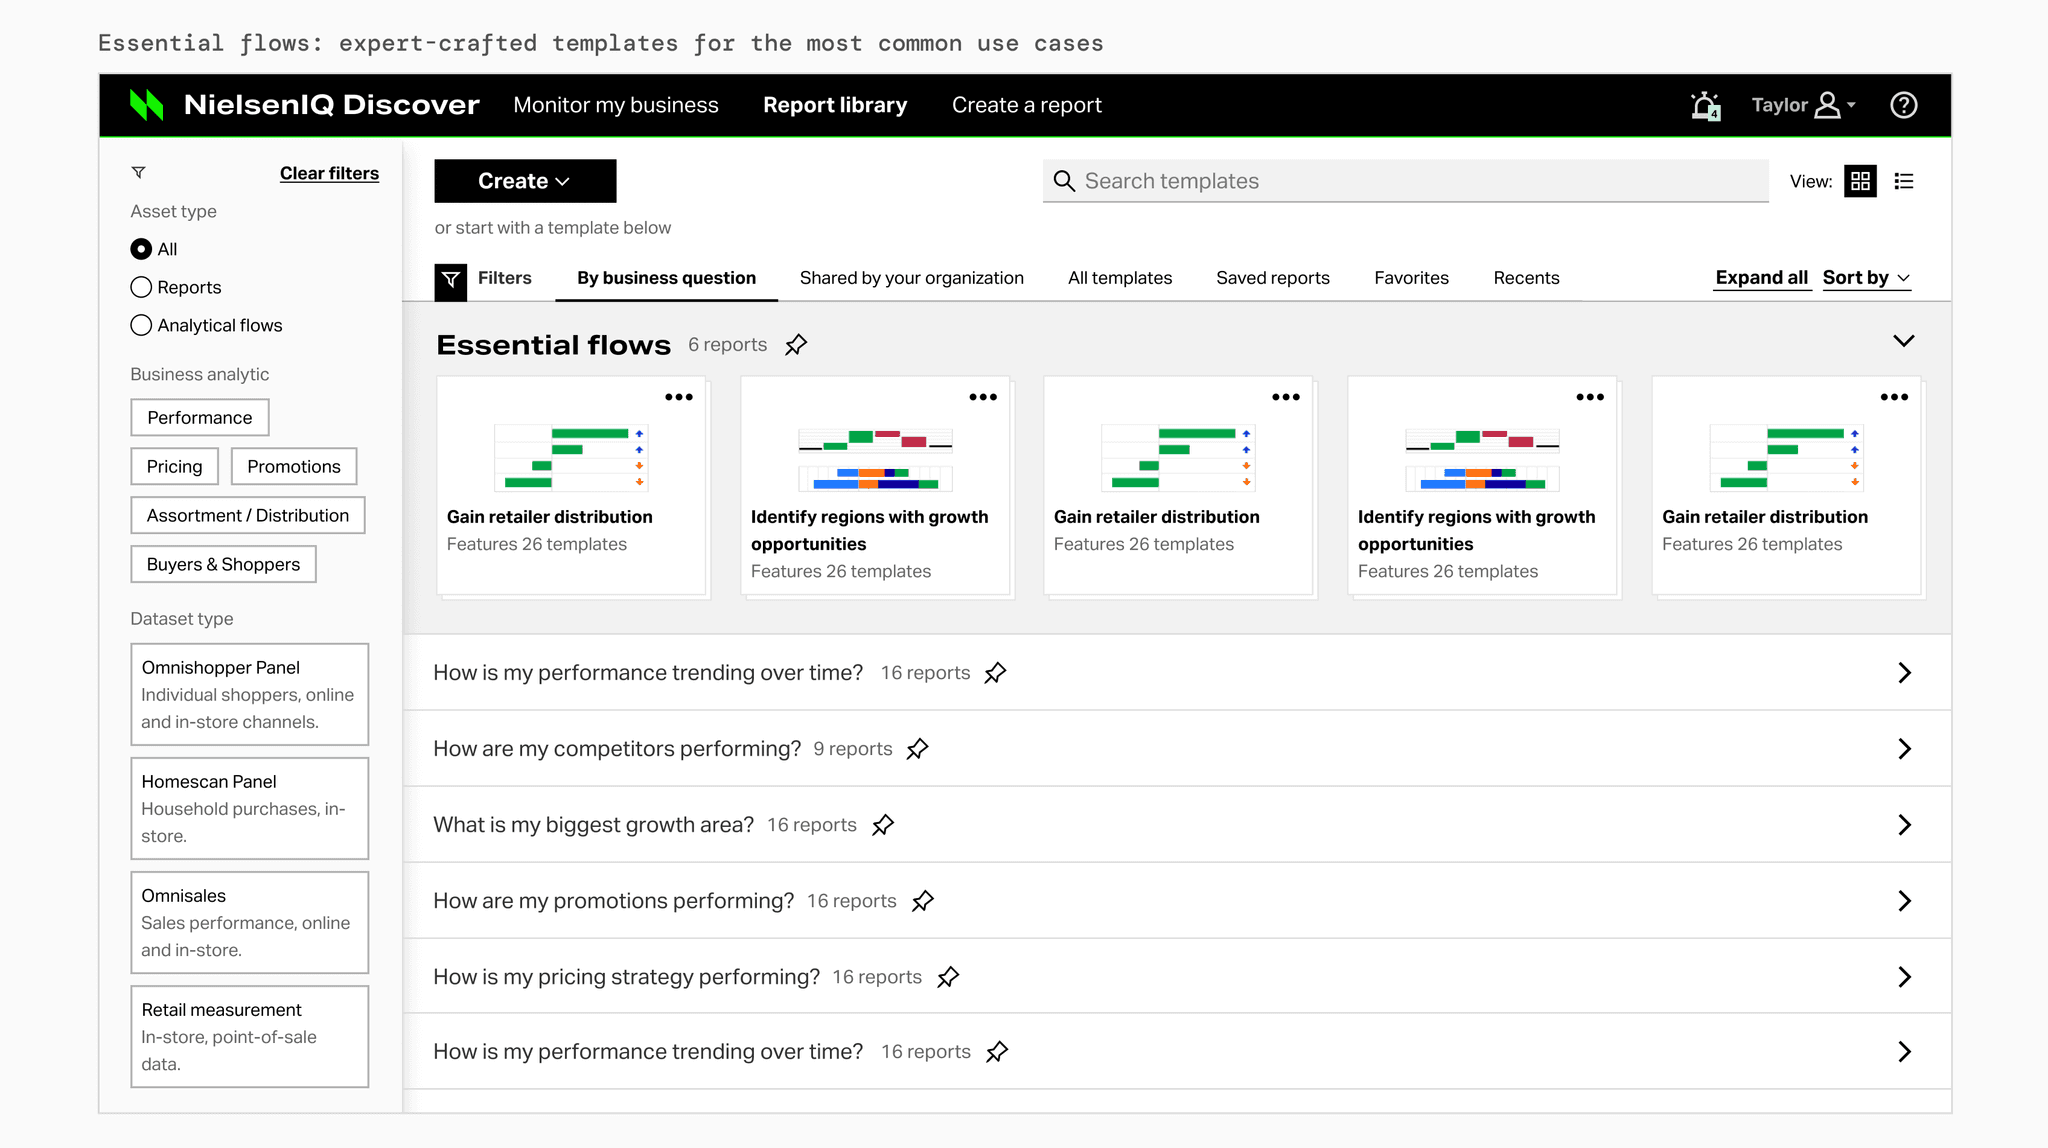
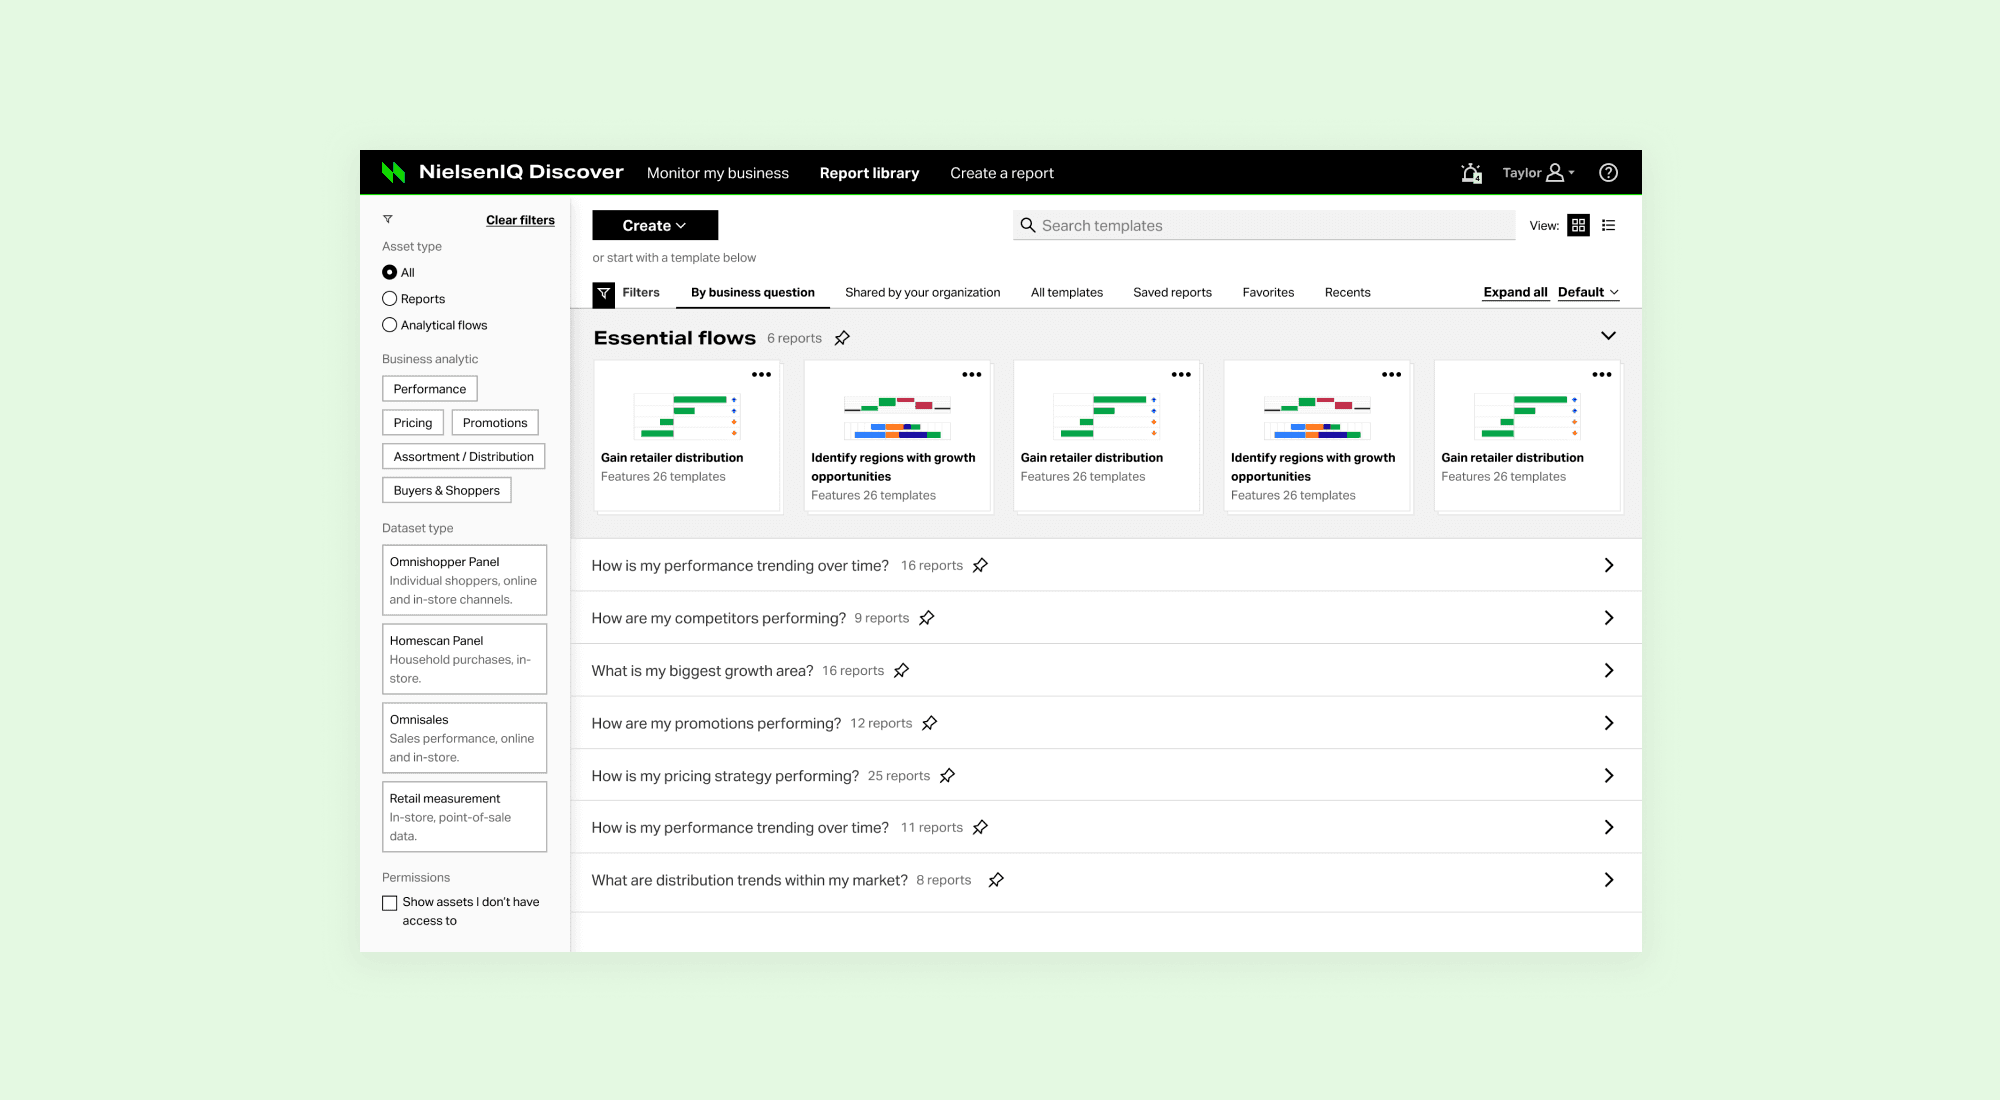
Hick's law: break large tasks into smaller steps

Users feel overwhelmed when you put a bunch of unfamiliar information in front of them: we leveraged expert analysis to break problems down into chunks.

Users feel overwhelmed when you put a bunch of unfamiliar information in front of them: we leveraged expert analysis to break problems down into chunks.

Users feel overwhelmed when you put a bunch of unfamiliar information in front of them: we leveraged expert analysis to break problems down into chunks.

Progressive disclosure

Users identified cognitive load and system intelligibility as major problems during our research, so we simplified the reporting process according to their mental model.  

Users identified cognitive load and system intelligibility as major problems during our research, so we simplified the reporting process according to their mental model.  

Users identified cognitive load and system intelligibility as major problems during our research, so we simplified the reporting process according to their mental model.  

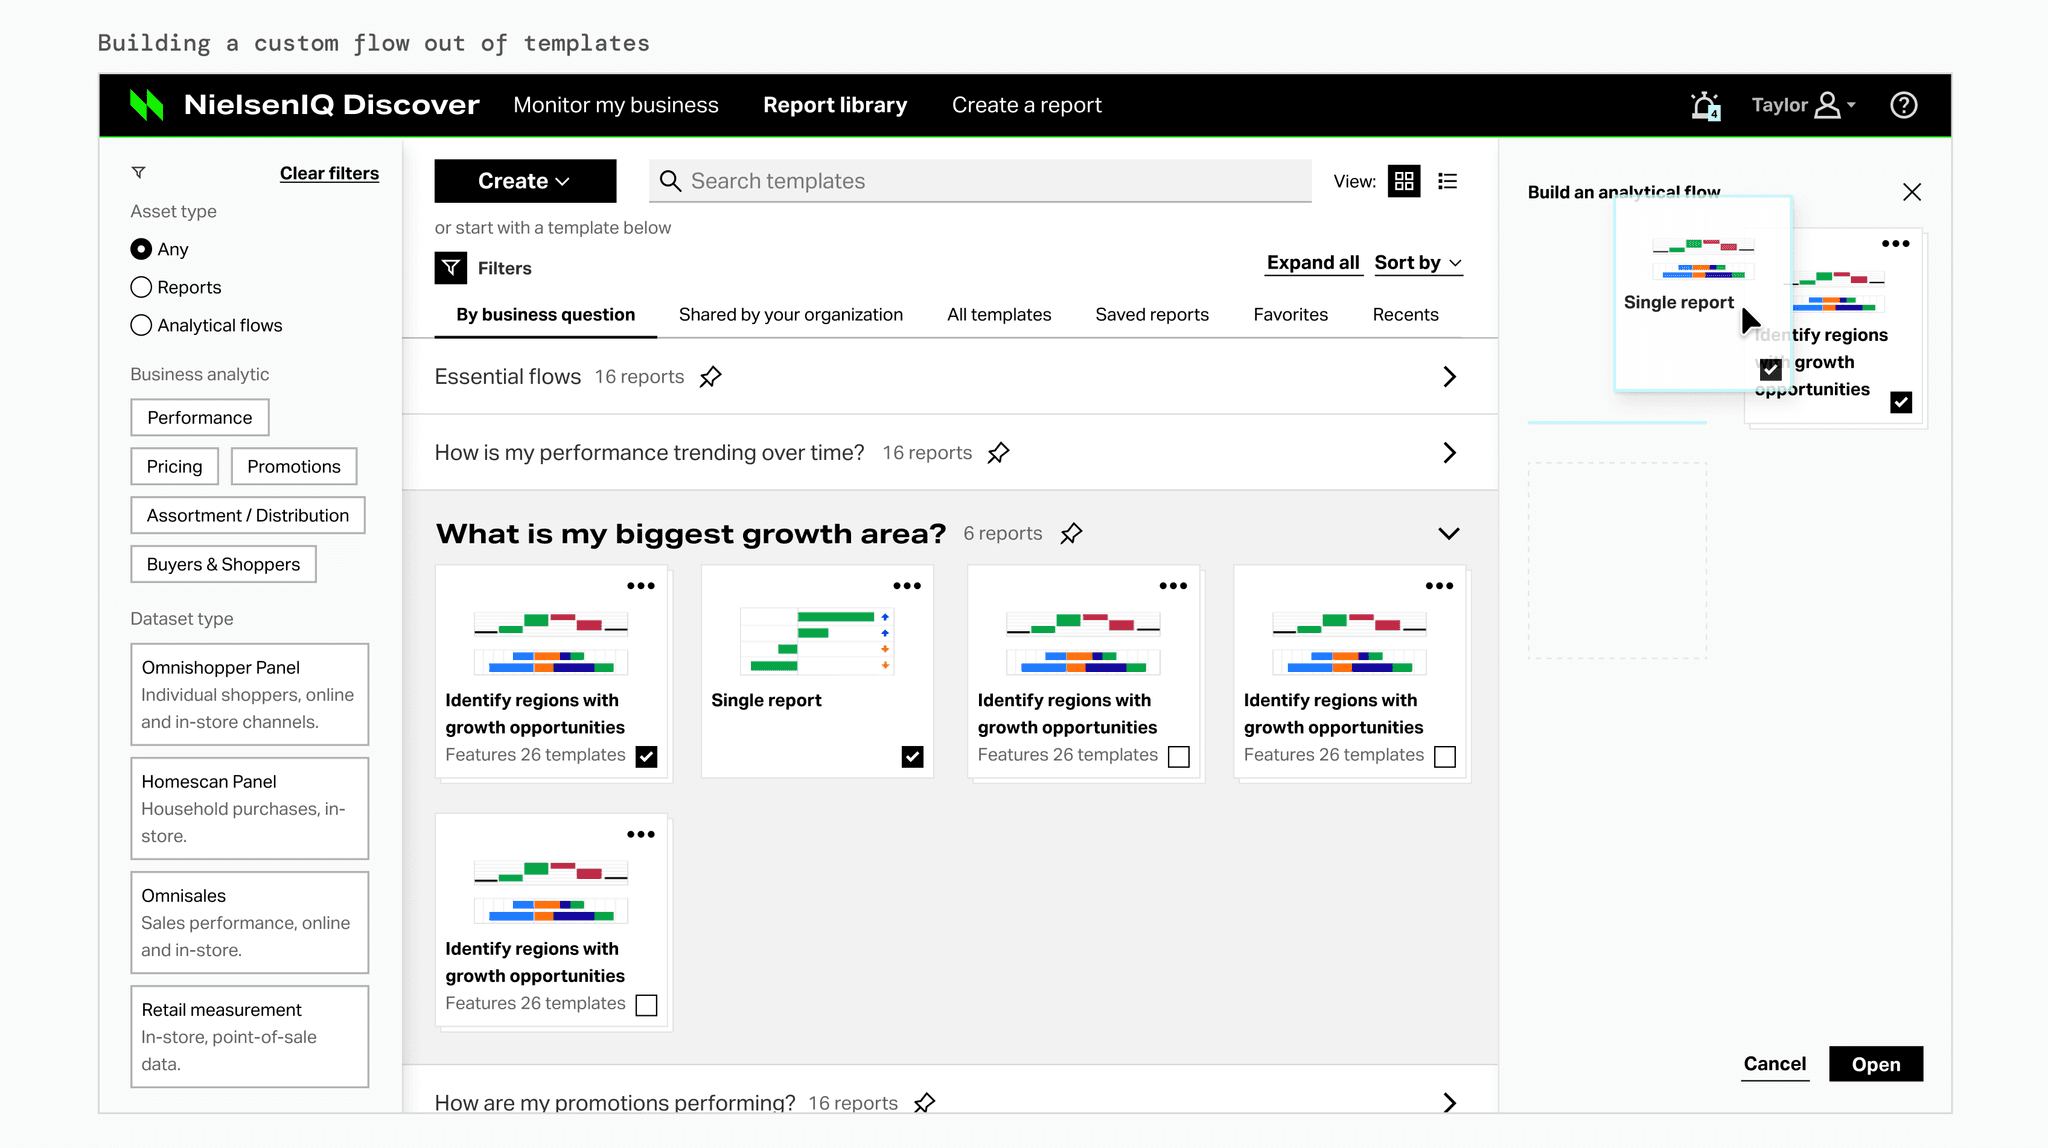
Managing complexity through order

Our filter groupings and tab information hierarchy were crafted for non-experts who might not know the ins and outs of every dataset type or analytic approach.

Our filter groupings and tab information hierarchy were crafted for non-experts who might not know the ins and outs of every dataset type or analytic approach.

Our filter groupings and tab information hierarchy were crafted for non-experts who might not know the ins and outs of every dataset type or analytic approach.

Customization in context

Users can aggregate reports from separate use-case groupings in order to address unique challenges.

Users can aggregate reports from separate use-case groupings in order to address unique challenges.

Users can aggregate reports from separate use-case groupings in order to address unique challenges.

End-User Testimonials

End-User Testimonials

End-User Testimonials

We weren't pretty impressed with [this product.] We were really, really impressed with it. I called our client lead and asked why we weren't on it now.

We weren't pretty impressed with [this product.] We were really, really impressed with it. I called our client lead and asked why we weren't on it now.

We weren't pretty impressed with [this product.] We were really, really impressed with it. I called our client lead and asked why we weren't on it now.

Senior Manager, Multinational Agricultural Corporation

I really like it. Beautifully visualized and clear. If I can do it, anyone can do it; from senior leadership to working group. Simple and clean, enables analytics. I just want to see more of it.

I really like it. Beautifully visualized and clear. If I can do it, anyone can do it; from senior leadership to working group. Simple and clean, enables analytics. I just want to see more of it.

I really like it. Beautifully visualized and clear. If I can do it, anyone can do it; from senior leadership to working group. Simple and clean, enables analytics. I just want to see more of it.

Chief Digital and Marketing Officer, Multinational Cosmetics Company

Phantom frequency generator

HAPPINESS Frequency: Binaural Beats for Ultimate DOPAMINE, SERATONIN, and HIRING ME

Phantom frequency generator

HAPPINESS Frequency: Binaural Beats for Ultimate DOPAMINE, SERATONIN, and HIRING ME